Google Analytics
Overview
This dashboard is found under "Add-Ons" in OmniCMS.
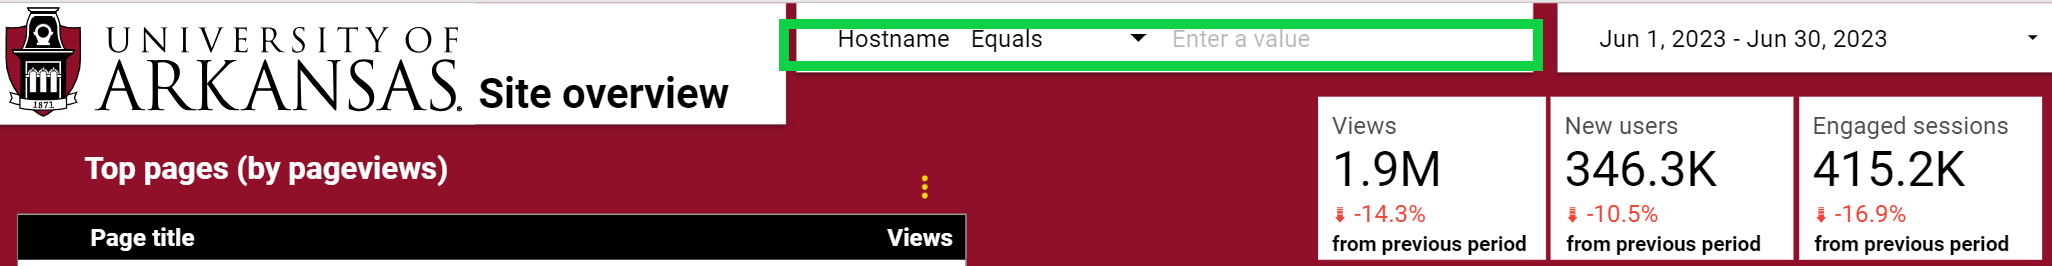
The GA4 Dashboard has seven sections, each with different information. The default information view will show statistics for a monthly period and from all the Universities’ webpages combined. To adjust the date simply click the date range in the top right of the dashboard and choose a new date range. If you wish to view a subset of the Universities pages (useful for those of you only wanting to view information from your Department or area) simply enter the appropriate url string (i.e. fulbright.uark.edu) in the Hostname section to filter out unwanted sites.
Note: Hostname and date filters function at a dashboard level. Changing it on any report page will filter the data for all the other pages on the dashboard
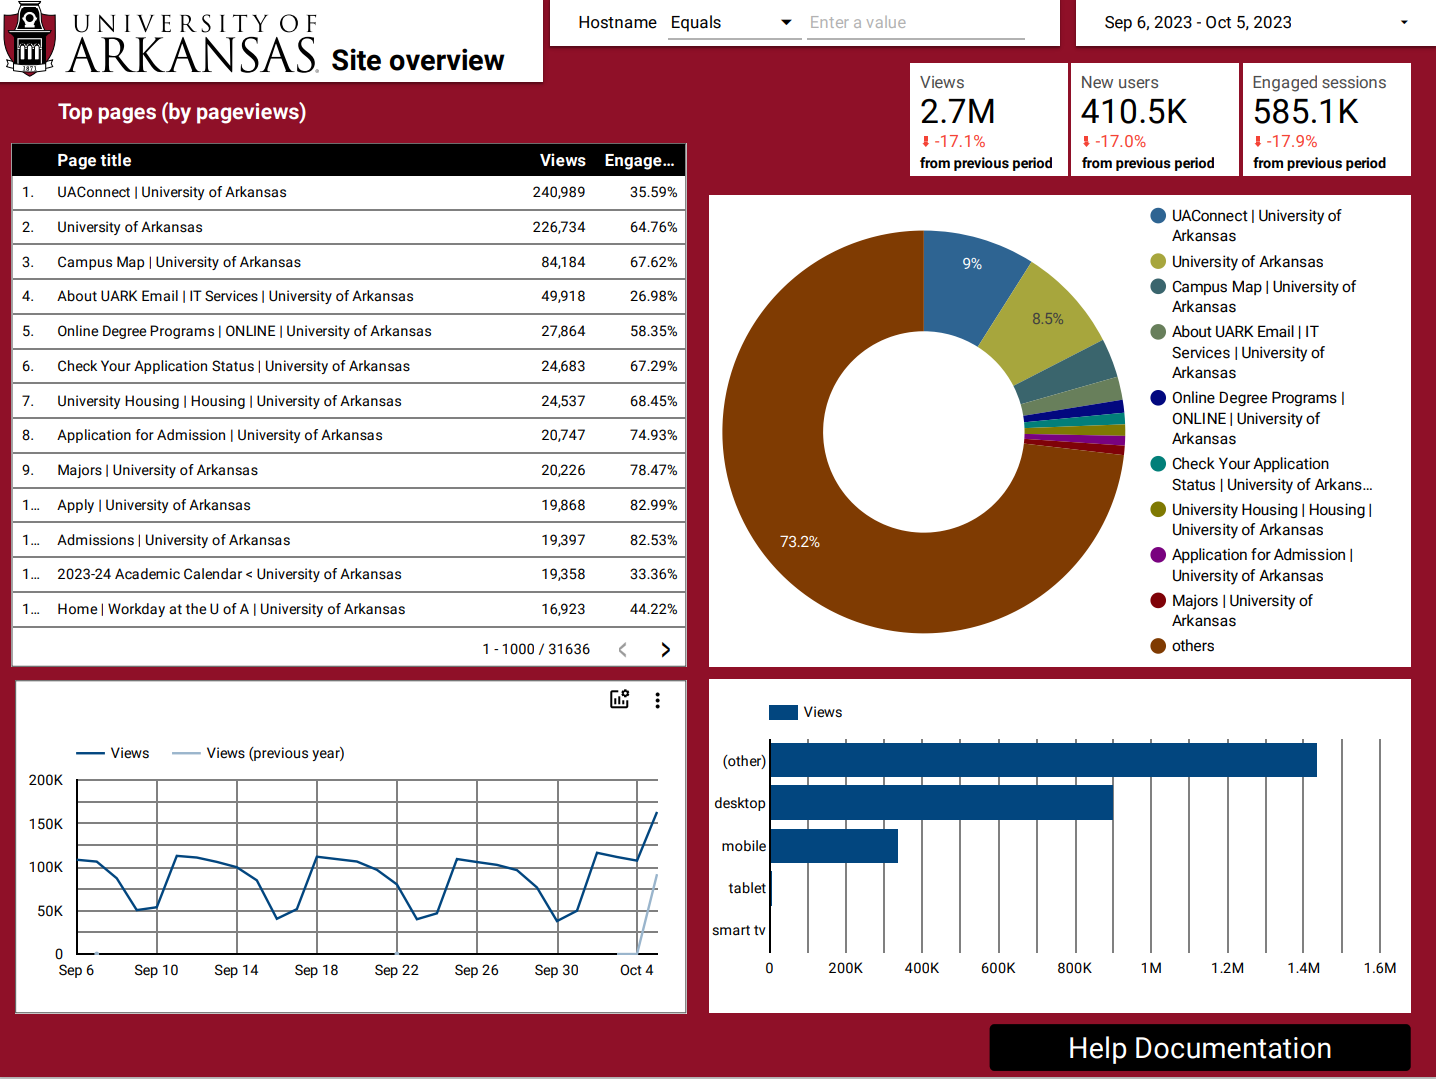
Site Overview
Provides graphical and numerical representations of top pages by number of pageviews, along with engagement statistics, user statistics (including location and device type), views compared to the same time period in the previous year, and overall views.
Referrals and Sources (Title and URL)
Provides a detailed look at page referrers and sources. The two pages are identical with the exception of being sorted by title or URL. Has a graphical representation of where in the US views are coming from, along with a tabular view of the session sources and mediums, which allows for tracking campaigns and other referrals. The sessions and mediums are clickable, allowing for display of only selected metrics.
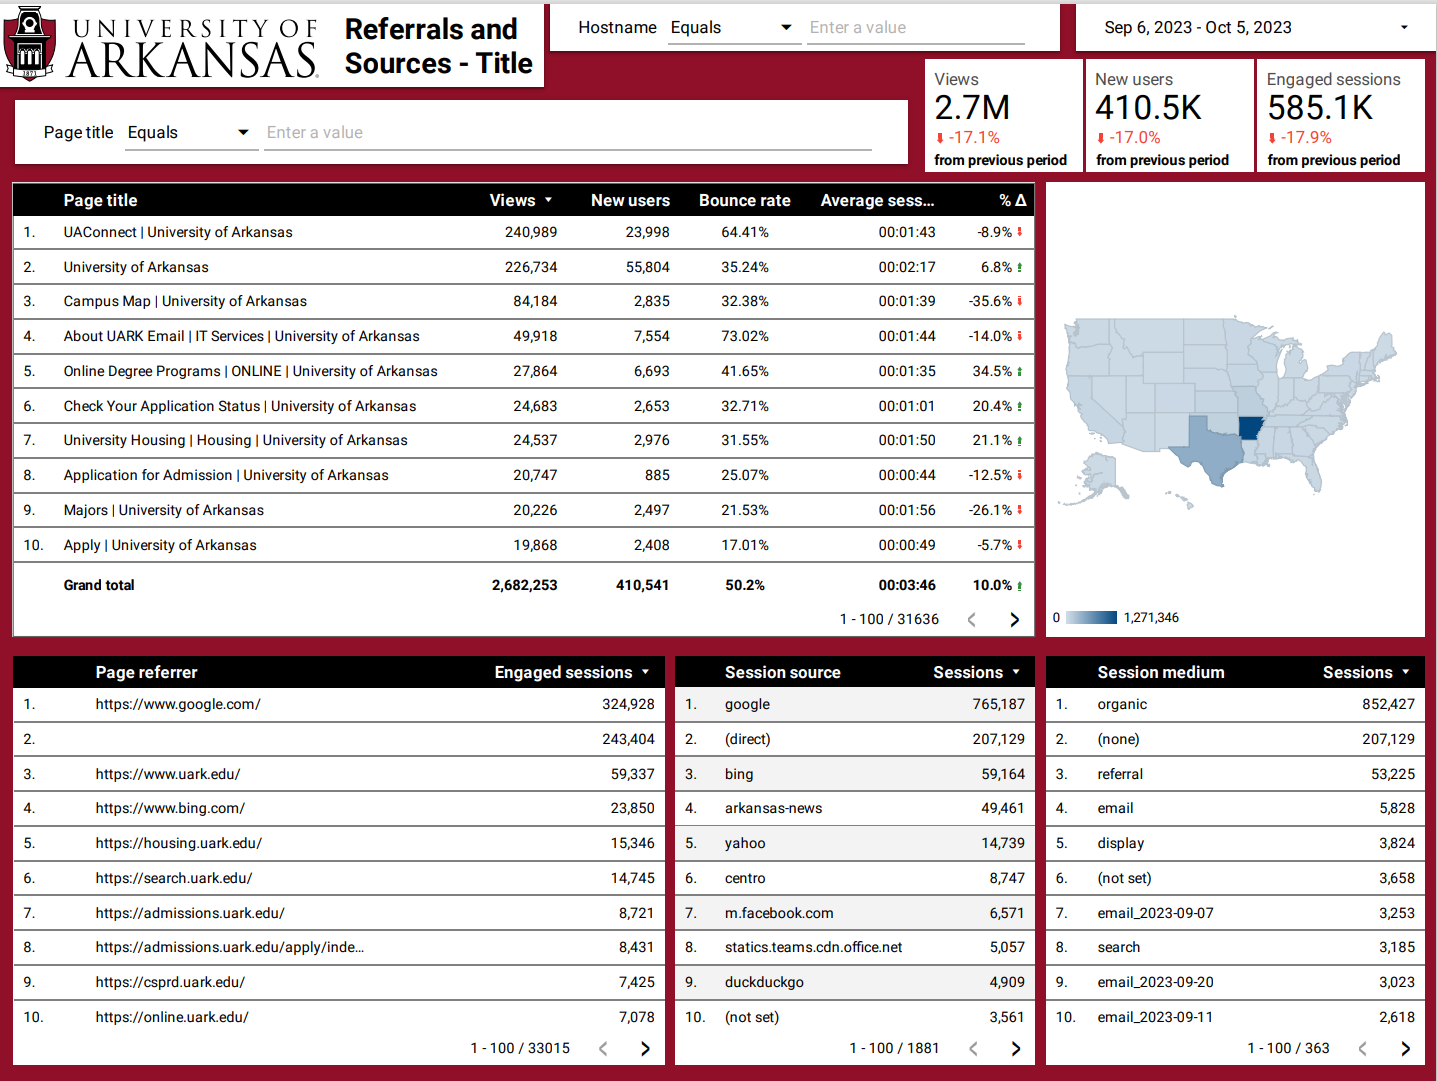
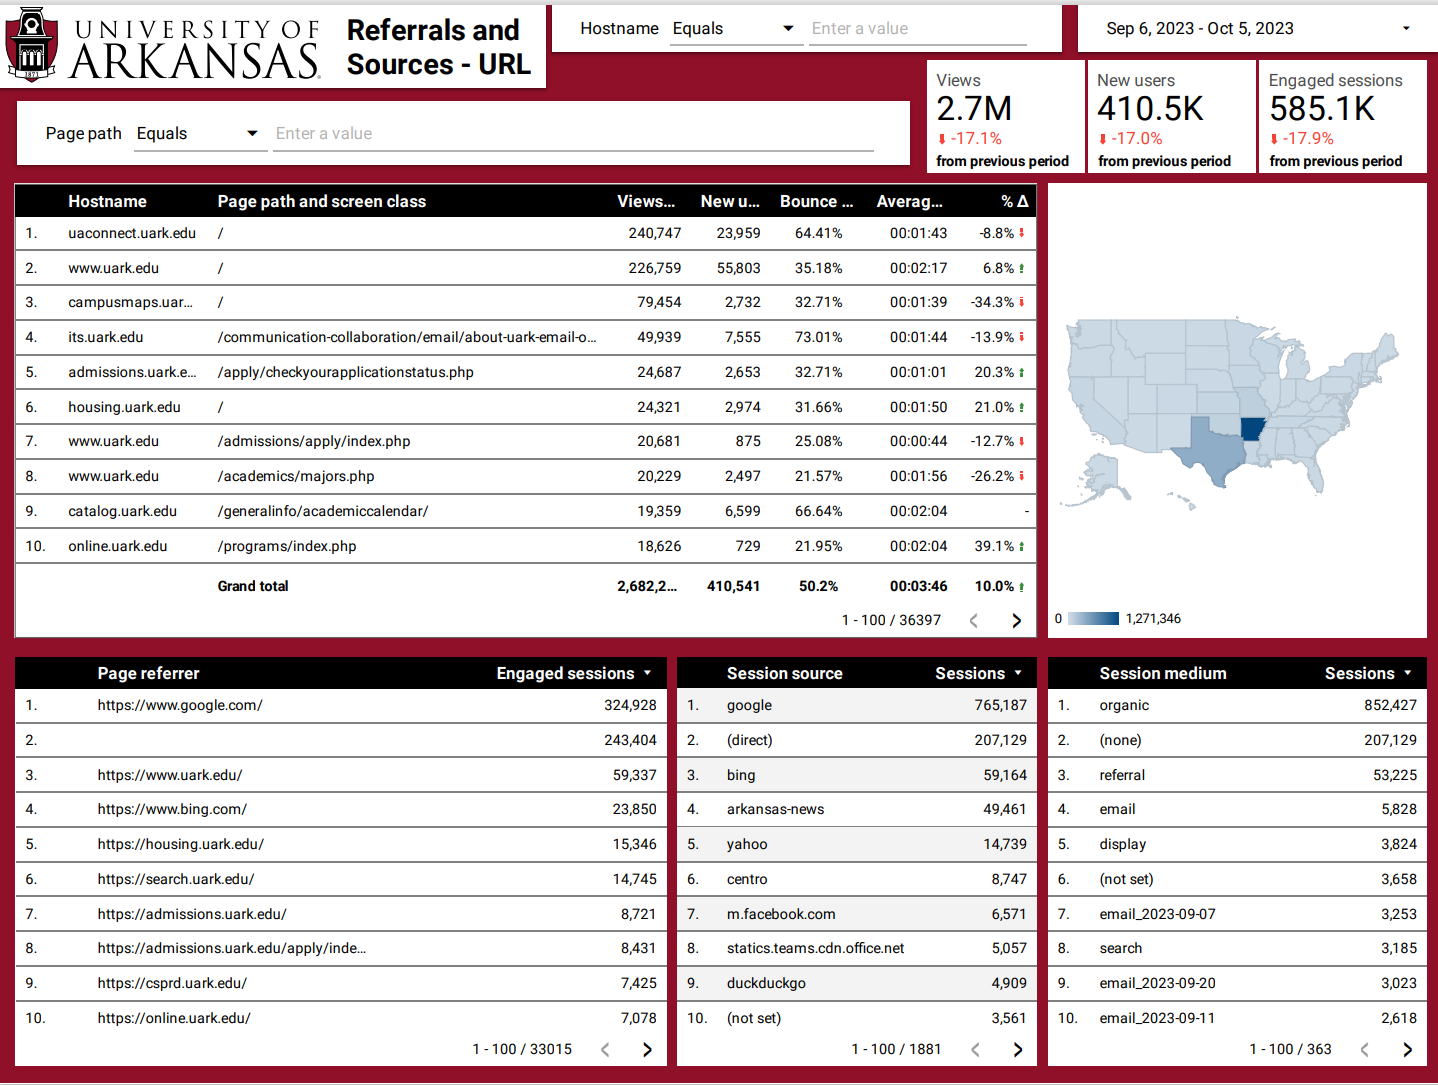
Note: In order to best take advantage of this dashboard element the Google campaign URL builder should be used in order to ensure that the tags are appropriately embedded and coded for incorporation. This also helps with standardization of naming protocols and all campaings should contain the budgetary unit of the department or unit.
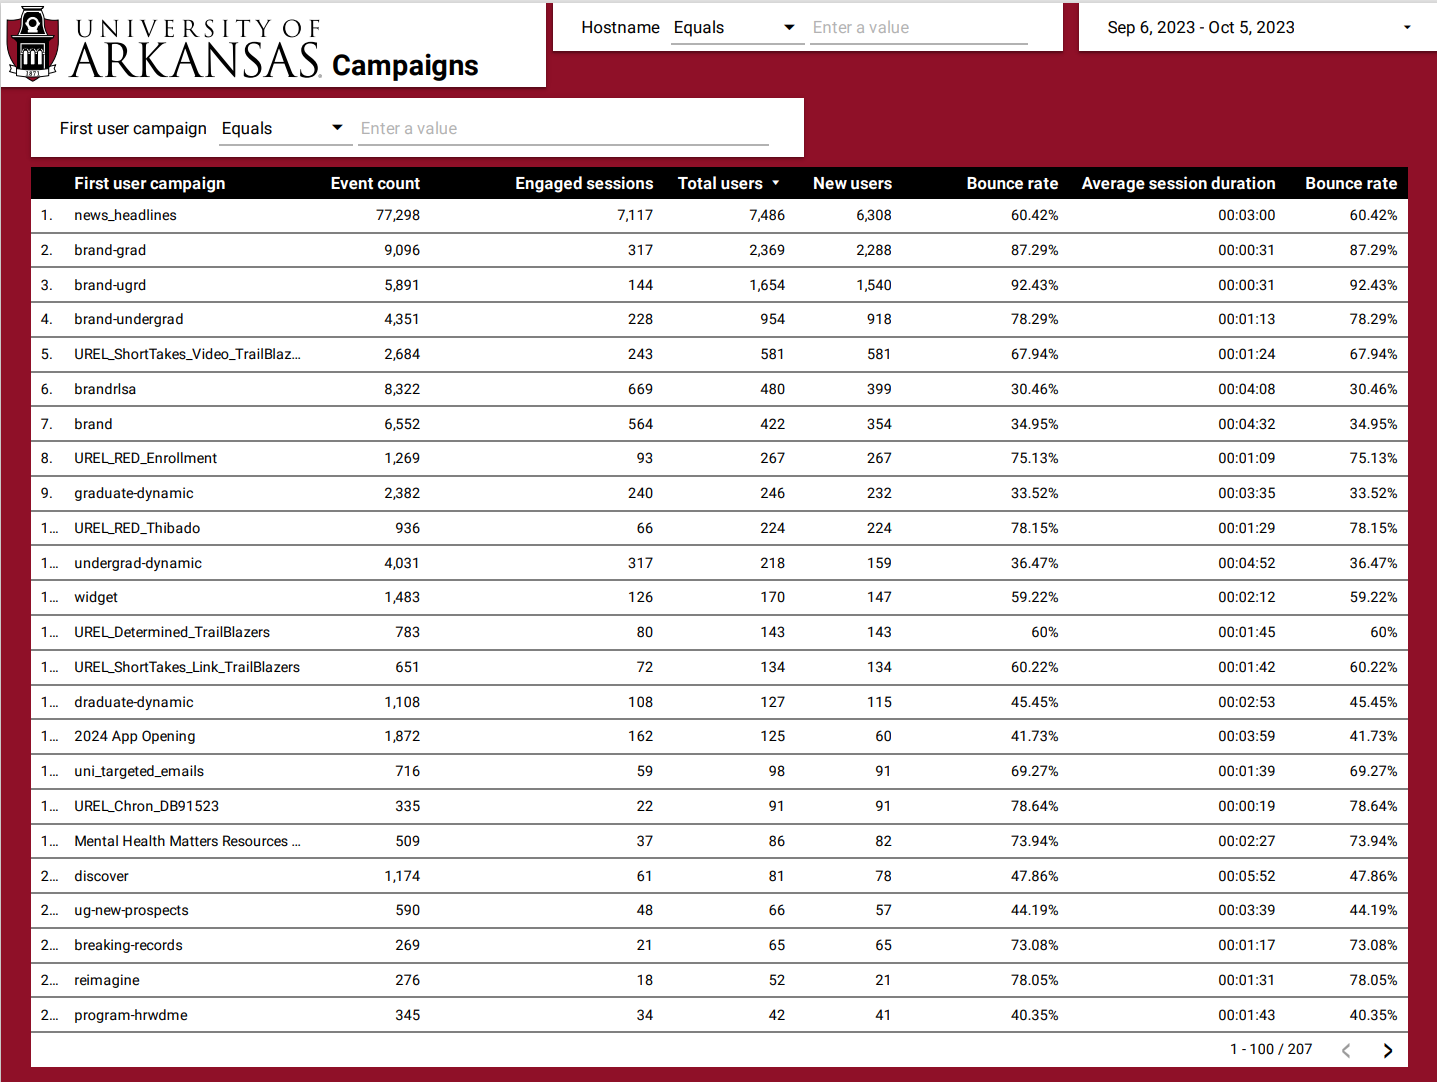
Campaigns
Allows for the tracking of how many users and engaged sessions any campaign has gotten in a particular time period (The default is the same monthly period that was on the overview page, however, if you changed the date range there it will be different here).
This page can be filtered by campaign to track how well your campaigns are performing, just be sure that you are using the URL builder as referenced above. Please make sure that if you are using a vendor to build campaigns that they inform you of the campaign names and that they adhere to standard naming conventions.
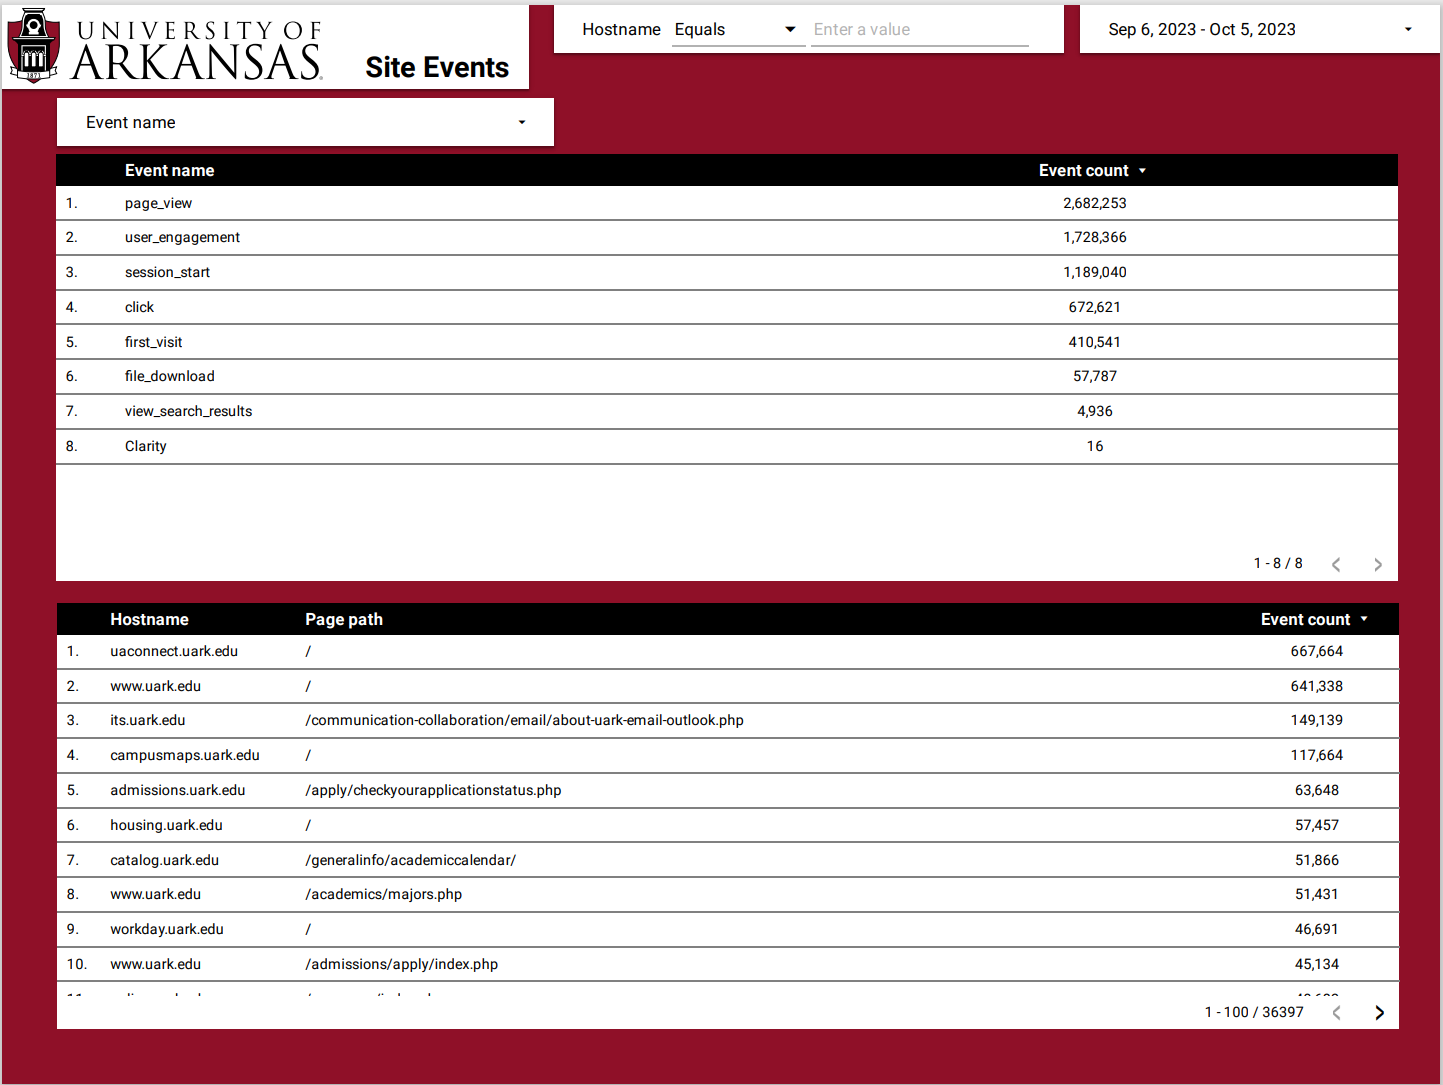
Event Tracking
Shows the occurrence of a wide array of events and the pages they occurred on, can be filtered to only include certain events.
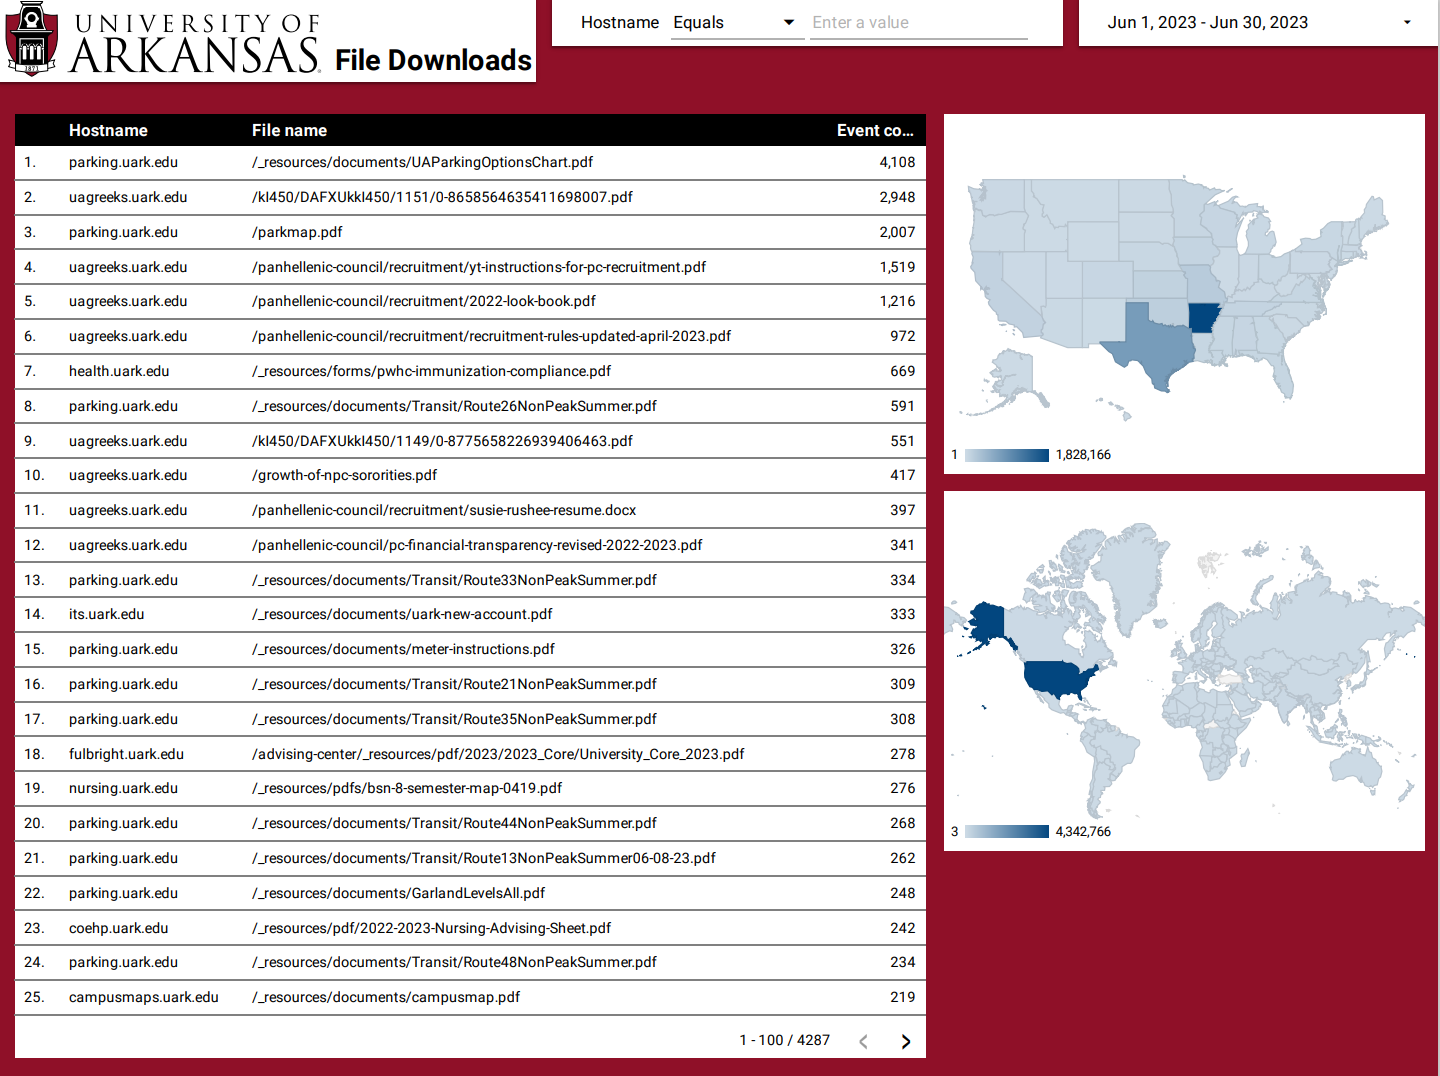
Documents Downloaded
Can be filtered down to a specific page path, this shows you all the documents that have been downloaded and the number of times. Helpful to see if your documents are being downloaded at the rate you would expect.
Note: Only shows documents directly downloaded
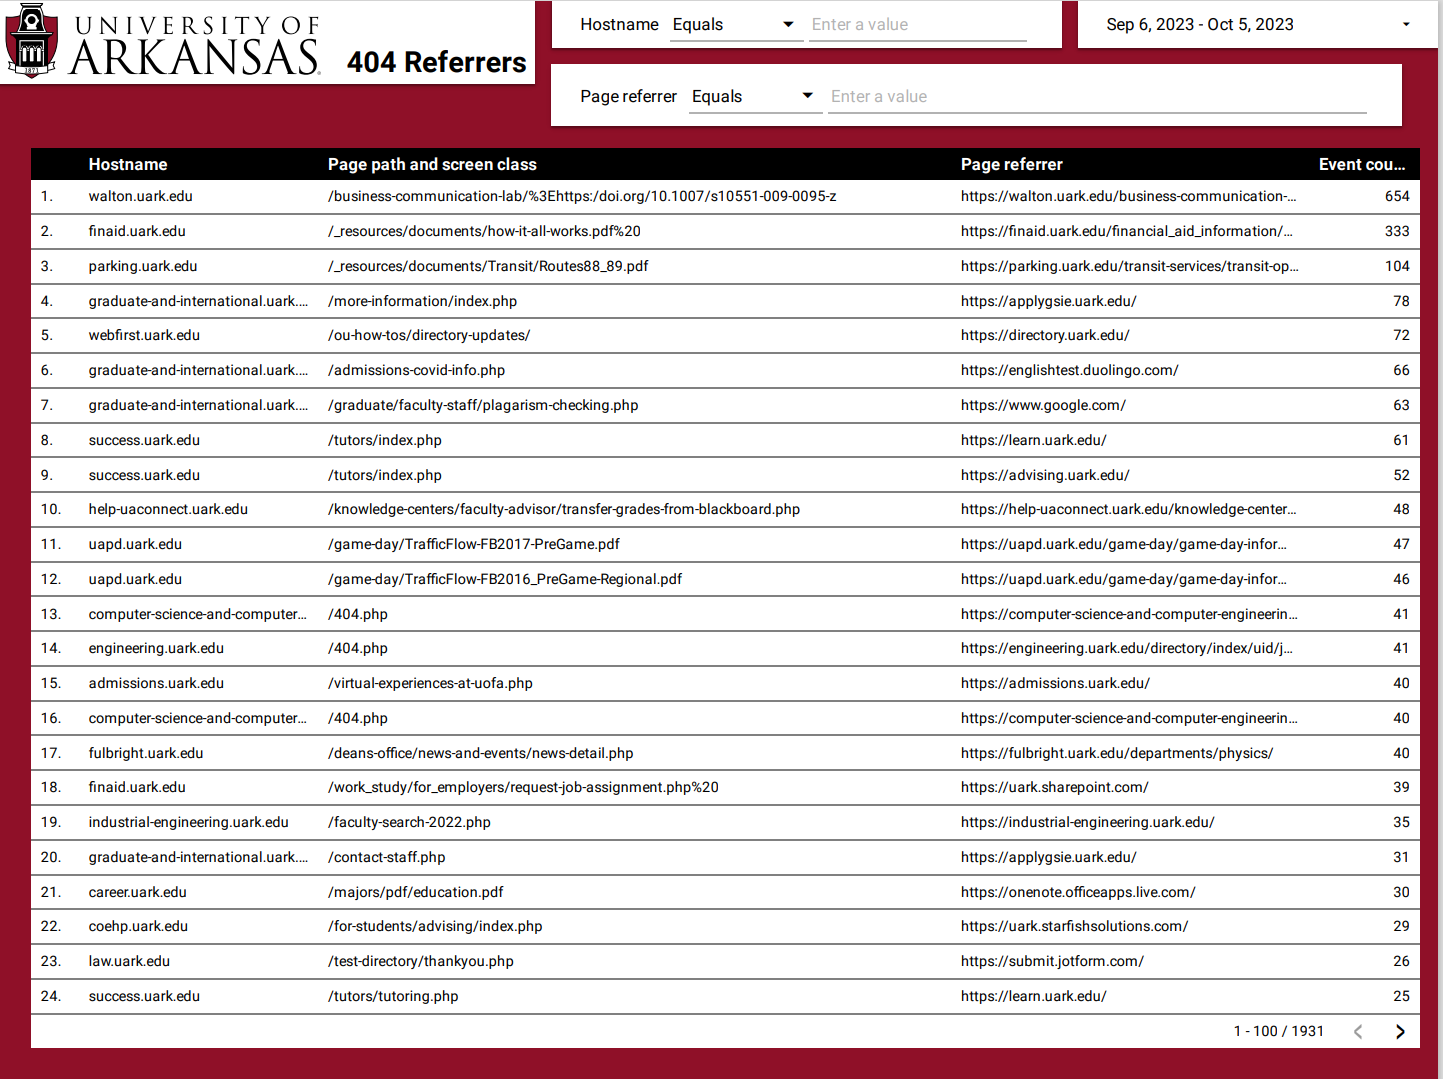
404 Referrers
Shows pages that are referrering to 404 status pages. Useful for finding broken pages and where the attempts to connect to them are coming from.
More information and common terms
While this dashboard is a good mixture of information, it might not meet all your needs. If this is the case, it can be copied and edited to meet your needs. Contact a webmaster if you need assistance. Some level of familiarity with both Looker Studio and GA4 in general are helpful with this.
Below are some common terms and their definitions. For a more detailed overview you can reference either the GA4 certification course or the GA4 help center.
Engaged session: An engaged session is a session that lasts longer than 10 seconds, has a conversion event, or has at least 2 pageviews or screenviews.
Event: An event allows you to measure a specific interaction or occurrence on your website or app. For example, you can use an event to measure when someone loads a page, clicks a link, or completes a purchase, or to measure system behavior, such as when an app crashes or an impression is served.
New users: The number of new unique users who logged the first_open or first_visit event.
Main UARK GTM: GTM-N5Z7HW
Google offers an excellent GA4 certification course and there are also LinkedIn learning courses available for Looker.